Contents
THe Singapore Budget 2015
- Video - The Budget Process
- 2015 Budget - Revenue and Expenditure
- Slideshow - Singapore Budget 2015 in brief
National Income Accounting
- Video - Circular flow of income
- Article - A historical look at the components of U.S. GDP: 1929 to 2011
- Video - Who really has the biggest economy? US or China?
- Article - GDP still relevant in assessing well being
Market Structures and Market Failures
- Public vs Private good
- Video - Managing traffic congestion in Singapore
- Video - Intellectual property & the pharma industry
- Video - Market structures and public transport policy
Students' Contributions
- Video - EDB film festival - Game theory
- Video - EDB film festival - Promoting sustainable and inclusive economic growth
The Singapore Budget 2015
The Budget Process
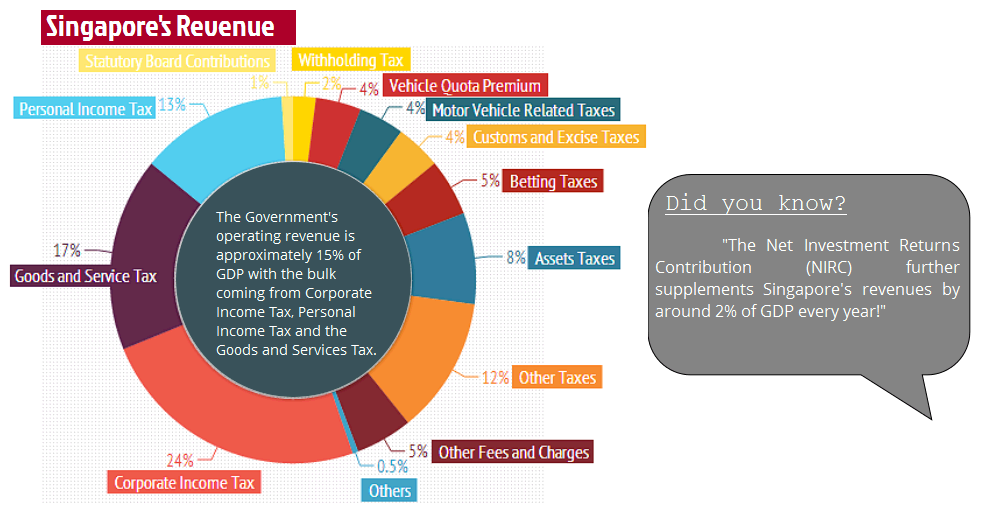
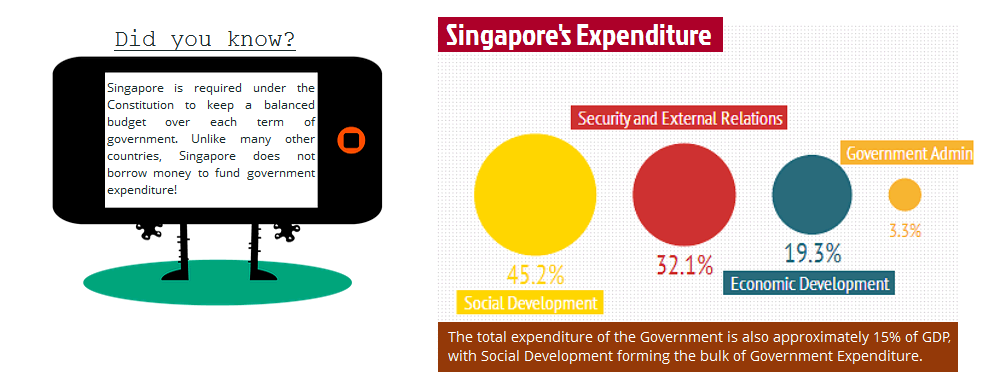
Singapore Budget 2015 In Brief
http://www.singaporebudget.gov.sg/budget_2015/Home.aspx
National Income Accounting
Circular Flow Of Income
A HISTORICAL LOOK AT THE COMPONENTS OF U.S. GDP: 1929 TO 2011
Intro
An economy is measured by its gross domestic product or GDP. GDP includes many components, each with a different level of importance. For example, the U.S. economy is a consumer-based economy because consumer spending is the largest component of GDP. China, on the other hand, has an export-based economy because exports are such a large part of China’s GDP. In this article, we’ll take a thorough look at the components that drive the U.S. economy and how it has changed since 1929. We’ll begin with an overview of U.S. GDP.
U.S. GDP: An Overview
U.S. GDP includes four components. Moreover, each component has a specific weighting and hence, a certain level of influence on total GDP. This influence also changes over time based on a number of factors. The following table contains the four components of U.S. GDP and the percentage that each contributed to total GDP in 2011.
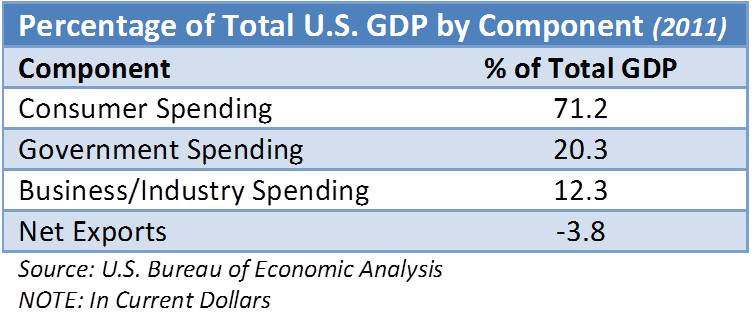
Based on data from the U.S. Bureau of Economic Analysis, in 2011, consumer spending was the most prominent, followed by government spending, business spending, and net exports. Therefore, when consumer spending decreases substantially, it has a dire effect on economic growth. Let’s examine each of these.
GDP Component: Consumer Spending
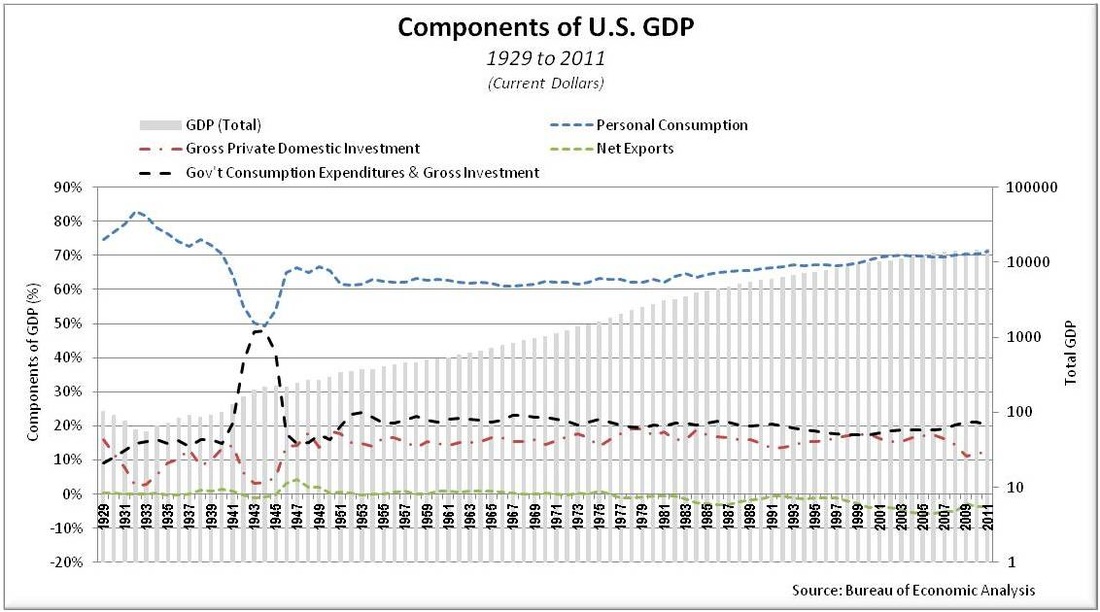
As you will see in the following chart, as a percentage of total GDP, consumer spending is the largest component. Over the years, it has fluctuated from a high of 83.0% in 1932 to a low of 49.5% in 1944. At the same time consumer spending was at its lowest, government spending was at its peak due to expenditures related to WWII. In the post WWII era, consumer spending has been greater than 60% of total GDP each year. Specifically, from 1946 to the end of 1980, consumer spending averaged 62.7%. From 1981 to 2011, it rose steadily, averaging 67.4% each year. Since 2003, however, it has averaged 70.1%. Having such a large percentage of the U.S. economy so dependent on consumer spending can be problematic. If consumer spending wanes, the economy will suffer.
GDP Component: Consumer Spending
As you will see in the following chart, as a percentage of total GDP, consumer spending is the largest component. Over the years, it has fluctuated from a high of 83.0% in 1932 to a low of 49.5% in 1944. At the same time consumer spending was at its lowest, government spending was at its peak due to expenditures related to WWII. In the post WWII era, consumer spending has been greater than 60% of total GDP each year. Specifically, from 1946 to the end of 1980, consumer spending averaged 62.7%. From 1981 to 2011, it rose steadily, averaging 67.4% each year. Since 2003, however, it has averaged 70.1%. Having such a large percentage of the U.S. economy so dependent on consumer spending can be problematic. If consumer spending wanes, the economy will suffer.
GDP Component: Government Spending
Government spending is the second largest component of GDP, but is well behind consumer spending. Government spending was 9.1% in 1929 and fairly stable until the U.S. entered WWII. During the period from 1929 through 1940, government spending averaged 14.2% of total U.S. GDP. When the U.S. entered the war, government spending rose sharply. In fact, from 1941 to 1945, government spending as a percentage of total GDP averaged a staggering 39.4%. Since the end of WWII, it has been stable, averaging 20.2% of total U.S. GDP.
GDP Component: Business/Industry Spending
The amount of capital spent by businesses is the most volatile component of GDP. This may indicate that business spending is the most economically sensitive of all components. For example, in 1929 during The Great Depression, business spending fell from 15.9% of total GDP to a low of 2.2% in 1932. It also declined significantly during WWII as factories were converted from manufacturing automobiles to war equipment. Businesses do not have the option of overspending to the same extent as the federal government. Although a business may borrow, if too much debt is acquired, bankruptcy will ensue. Therefore, a business must operate within prudent budget constraints.
GDP Component: Net Exports
Net exports is the difference between total imports and total exports. For example, if we export $750k and import $1 million, net exports would be negative $250k (exports minus imports). When exports are greater than imports we are a net seller. If imports exceed exports, we are a net buyer. When we are a net seller the effect on GDP is positive. Conversely, as a net buyer, GDP is reduced.
During the period from 1929 to 1971, net exports were negative in only 7 of the 43 years or 16% of the time. However, from 1972 through 2011, net exports were negative in 38 of the 40 years or 95% of the time. Therefore, since the early 1970s, net exports have been a drag on economic growth. A tipping point occurred in 1983. To explain, from 1929 through 1982, net exports averaged 0.4% per year which increased GDP. From 1983 to 2011, net exports were negative, averaging -2.8% per year. In other words, since 1983, the U.S. has imported more than it has exported which has reduced GDP.
Conclusion
We have discussed how GDP consists of four parts with consumer spending being the most important. Based on this, what should government do to stimulate the economy? Answer: Stimulate consumer spending. How? We’ll tackle that in more detail another time. However, here’s some food for thought. To stimulate consumer spending, individuals must be employed. To achieve full employment – which is around 5.0% according to the Fed – businesses must have a reason to hire. Therefore, government must provide an incentive for businesses and consumers so businesses will hire and consumers will spend. Because debt was such a significant part of the economic boon between 1982 and 2007, it took a while for consumers and businesses to retrench. The past two quarters indicated a rebound in GDP. Why is GDP on the rebound? Is it a result of government policies or in spite of? I believe it’s the latter. Whatever the reason let’s hope it continues.
Article from Forbes.com, 30/12/2014
Government spending is the second largest component of GDP, but is well behind consumer spending. Government spending was 9.1% in 1929 and fairly stable until the U.S. entered WWII. During the period from 1929 through 1940, government spending averaged 14.2% of total U.S. GDP. When the U.S. entered the war, government spending rose sharply. In fact, from 1941 to 1945, government spending as a percentage of total GDP averaged a staggering 39.4%. Since the end of WWII, it has been stable, averaging 20.2% of total U.S. GDP.
GDP Component: Business/Industry Spending
The amount of capital spent by businesses is the most volatile component of GDP. This may indicate that business spending is the most economically sensitive of all components. For example, in 1929 during The Great Depression, business spending fell from 15.9% of total GDP to a low of 2.2% in 1932. It also declined significantly during WWII as factories were converted from manufacturing automobiles to war equipment. Businesses do not have the option of overspending to the same extent as the federal government. Although a business may borrow, if too much debt is acquired, bankruptcy will ensue. Therefore, a business must operate within prudent budget constraints.
GDP Component: Net Exports
Net exports is the difference between total imports and total exports. For example, if we export $750k and import $1 million, net exports would be negative $250k (exports minus imports). When exports are greater than imports we are a net seller. If imports exceed exports, we are a net buyer. When we are a net seller the effect on GDP is positive. Conversely, as a net buyer, GDP is reduced.
Conclusion
We have discussed how GDP consists of four parts with consumer spending being the most important. Based on this, what should government do to stimulate the economy? Answer: Stimulate consumer spending. How? We’ll tackle that in more detail another time. However, here’s some food for thought. To stimulate consumer spending, individuals must be employed. To achieve full employment – which is around 5.0% according to the Fed – businesses must have a reason to hire. Therefore, government must provide an incentive for businesses and consumers so businesses will hire and consumers will spend. Because debt was such a significant part of the economic boon between 1982 and 2007, it took a while for consumers and businesses to retrench. The past two quarters indicated a rebound in GDP. Why is GDP on the rebound? Is it a result of government policies or in spite of? I believe it’s the latter. Whatever the reason let’s hope it continues.
Who Really Has The Biggest Economy- US or China?
GDP Still Relevant In Assessing Well Being

How do you assess the well-being of a country?
There are many measures and rankings of well-being in circulation. For example, Singapore ranks among the top six economies of the world in terms of income per capita. And according to the 2013 Human Development Report and the 2013 World Happiness Report, both published by the United Nations, Singapore is placed 18th and 30th respectively.
What do these different measures mean? Let us begin with the economic dimension. Within the field of economics, gross domestic product (GDP) has become the standard metric of economic well-being. GDP measures the total value of goods and services produced within a country during a specified period. It also indicates the total income earned within a country's borders.
To compare across countries, GDP is usually expressed in purchasing power parity dollars (to take into account price differences across countries) and in per capita terms (to reflect an average standard of living in a country). The sister measure, gross national product (GNP), is the total value of goods and services produced in a specified period by the nationals of a country. Unlike GDP, which defines production based on geographical location, GNP accounts for production based on ownership of the production inputs.
The twin measures of GDP and GNP arose out of the work of economists Simon Kuznets and Richard Stone, who developed the system of national accounting in the 1930s. These were formally adopted by the International Monetary Fund and the World Bank in the 1940s. Although the initial emphasis was on GNP, the focus shifted to GDP in the 1980s.
GDP and GNP, as measures of success and well-being, have several limitations. They leave out non-market transactions (for example, unpaid household work or child care), do not distinguish between market transactions that increase versus decrease well-being (for instance, building schools versus prisons) and ignore sustainability issues (for example, cutting down forests). The measures do not adequately capture other important aspects of well-being either, such as education, health, the rule of law and freedom.
The most widely accepted alternative measure, to date, is the Human Development Index (HDI) developed by economists Mahbub Ul Haq and Amartya Sen for the UN Development Programme in 1990. The HDI was developed as a composite indicator of human development incorporating education outcomes, health outcomes and income.
Broadly speaking, there is a positive relationship between income levels and HDI scores. However, the relationship is not always clear-cut. There are some countries with low HDI scores despite relatively high income levels (such as Kuwait and Oman), and also countries with similar HDI scores but quite different income levels (like Indonesia and South Africa).
"Green GDP" has been proposed as a measure which would take into account the depletion of natural resources and the cost of environmental degradation. These environmental costs are monetised and deducted from traditional GDP. Economist Joseph Stiglitz has been a key proponent of this concept. China's first green GDP accounting exercise revealed that the economic loss caused by environmental pollution alone (ignoring costs of natural resource depletion and ecological damage) amounted to 511.8 billion yuan or 3 per cent of GDP in 2004.
The search for alternatives continues. The Commission on the Measurement of Economic Performance and Social Progress, led by three economists - Professor Sen, Professor Stiglitz and Professor Jean-Paul Fitoussi - identified eight dimensions of well-being as indicators of social progress, of which material living standards was only one.
Similarly, the Organisation for Economic Cooperation and Development developed the Better Life Index in 2011. It incorporated three dimensions of material living conditions and eight dimensions of quality of life. And the UN Sustainable Development Solutions Network released the first World Happiness Report in 2012, based on subjective measures of well-being from nationally conducted surveys.
So does all this make GDP irrelevant? Not quite. Income is still a vital and necessary aspect of well-being. And what is measurable is more manageable. But it is certainly not all-sufficient.
So the current call to action would be to: first, improve upon the methodologies of alternative measures; and second, consider a variety of measures which capture different aspects of well-being, rather than focusing on a single metric.
This article was published on May 8 in The Straits Times
